
Key Takeaways
- Replacing a single registered nurse costs an average of $56,300, and hospitals spent a combined $6.6 billion on RN turnover in 2024
- Travel nurse bill rates remain 40 to 70 percent above staff nurse rates even after the 2022 peak subsided
- Healthcare staffing agencies typically add a 40 to 60 percent markup over base wages for temporary clinical staff
- The U.S. faces a projected shortage of 37,800 to 124,000 physicians by 2034, with primary care hit hardest
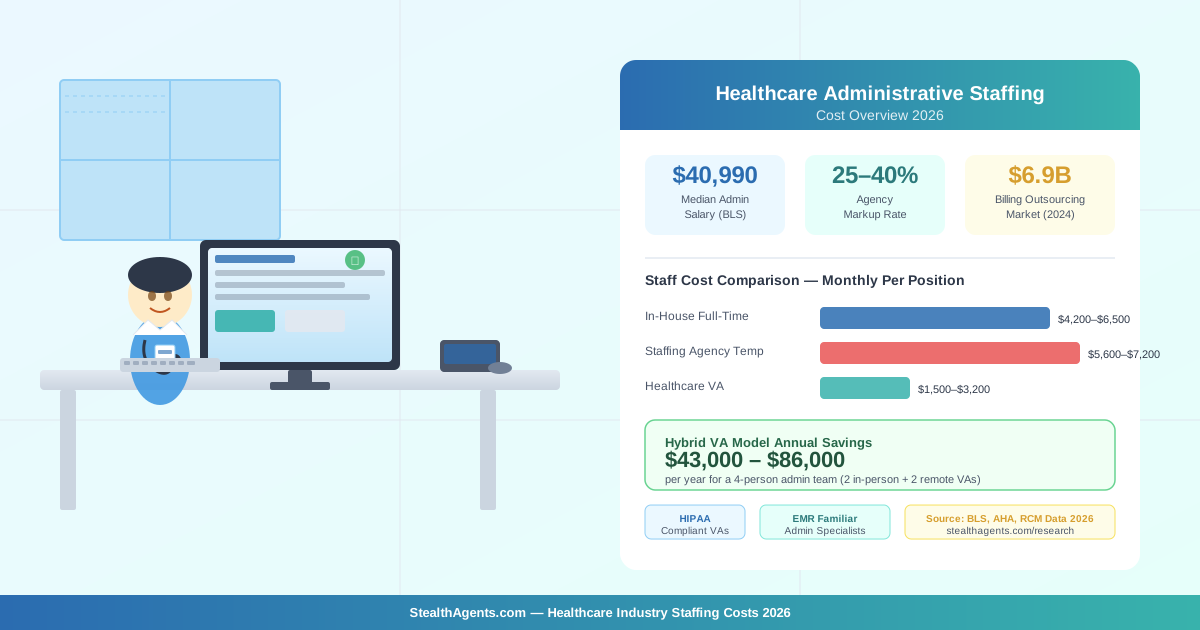
- Healthcare administrative roles cost 60 to 75 percent less when handled by trained virtual assistants versus in-house staff
Healthcare industry staffing costs 2026: the full picture
Healthcare has one of the most complicated labor markets in the U.S. economy, and 2026 is not making it simpler. Nursing shortages that started during the pandemic never fully resolved. Physician supply has not kept pace with an aging population. Agency and travel staffing, which ballooned as a stop-gap measure, left permanent cost structures behind even as the acute crisis eased. Administrative overhead keeps growing.
This article uses 2025 and 2026 data from the Bureau of Labor Statistics, NSI Nursing Solutions, the Association of American Medical Colleges, Mercer, AMN Healthcare, and the American Hospital Association to give hospital administrators, practice managers, and staffing decision-makers an accurate baseline for the year ahead.
1. The shortage problem that shapes every other number
Healthcare staffing costs are high partly because the supply of qualified workers has not kept up with demand for years. That gap has consequences across every role and every budget line.
- The Bureau of Labor Statistics projected that healthcare occupations would add about 1.8 million jobs between 2022 and 2032, a growth rate of 13 percent that is faster than any other sector (BLS Occupational Outlook Handbook, 2024).
- The U.S. will face a shortage of between 37,800 and 124,000 physicians by 2034, according to the Association of American Medical Colleges. Primary care accounts for the largest share: a projected deficit of 20,200 to 40,400 primary care physicians (AAMC, The Complexities of Physician Supply and Demand, 2024).
- Registered nurse vacancy rates held at 16.8 percent nationally in 2024, down from the 2022 peak of 17.1 percent but still well above the pre-pandemic baseline of 8 to 10 percent (NSI Nursing Solutions, 2025 National Health Care Retention and RN Staffing Report).
- Demand for home health aides and personal care aides will grow by 22 percent through 2032, adding approximately 924,000 new positions in just those two roles (BLS, 2024).
- Allied health occupations including radiologic technologists, respiratory therapists, and clinical lab technicians face supply shortfalls ranging from 17 to 29 percent in high-demand metro markets (AMN Healthcare, 2025 Allied Workforce Shortage Survey).
The shortage is not one problem. It is a collection of overlapping role-specific deficits, each with different wage, recruiting, and retention dynamics. That is why labor costs in healthcare rarely move in a single direction.
2. Wages by role: 2026 national averages
The Bureau of Labor Statistics Occupational Employment and Wage Statistics program, updated through May 2024 and released in March 2025, provides the most reliable national wage baseline available for healthcare roles.
| Role | Median Hourly Wage | Median Annual Wage | BLS SOC Code |
|---|---|---|---|
| Registered Nurse (RN) | $41.38 | $86,070 | 29-1141 |
| Nurse Practitioner (NP) | $62.40 | $129,790 | 29-1171 |
| Licensed Practical Nurse (LPN) | $28.72 | $59,730 | 29-2061 |
| Medical Assistant | $19.57 | $40,700 | 31-9092 |
| Surgical Technologist | $29.40 | $61,150 | 29-2055 |
| Radiologic Technologist | $31.81 | $66,170 | 29-2034 |
| Respiratory Therapist | $34.24 | $71,210 | 29-1126 |
| Phlebotomist | $19.35 | $40,200 | 31-9097 |
| Pharmacy Technician | $18.64 | $38,780 | 29-2052 |
| Healthcare Social Worker | $28.57 | $59,420 | 21-1022 |
| Medical Secretary / Admin | $20.36 | $42,350 | 43-6013 |
| Medical Records Specialist | $23.74 | $49,370 | 29-2072 |
| Patient Services Representative | $18.11 | $37,680 | 43-4171 |
Source: BLS Occupational Employment and Wage Statistics, May 2024 (released March 2025).
These are base wages. Fully loaded labor cost adds employer payroll taxes (7.65% FICA), health insurance contributions (averaging $8,400 to $14,000 per employee per year depending on plan and coverage tier), paid time off accrual, retirement matching, and malpractice or liability coverage. That typically brings the true annual cost to between 1.28x and 1.42x base salary for clinical staff and 1.25x to 1.35x for administrative roles (Mercer National Survey of Employer-Sponsored Health Plans, 2025; SHRM Benefits Benchmarking Report, 2025).
Geographic variation
Location moves healthcare wages substantially. The same RN role pays differently across major metro areas:
| Metro Area | RN Mean Annual Wage | Premium vs. National Median |
|---|---|---|
| San Jose, CA | $151,640 | +76% |
| San Francisco, CA | $145,900 | +70% |
| Vallejo, CA | $141,260 | +64% |
| Sacramento, CA | $118,450 | +38% |
| Seattle, WA | $107,930 | +25% |
| Boston, MA | $101,520 | +18% |
| New York, NY | $98,730 | +15% |
| Dallas, TX | $82,640 | -4% |
| Phoenix, AZ | $80,880 | -6% |
| Birmingham, AL | $68,430 | -20% |
Source: BLS OEWS by Metropolitan Statistical Area, May 2024.
The California premium is in a category by itself. A hospital system in San Francisco pays the equivalent of a Birmingham salary and a half for the same RN role. That math is why California-based systems have been among the most aggressive adopters of remote administrative support models.
3. Healthcare staffing agency markups and travel nurse premiums
Healthcare staffing agencies operate on a different cost model than the wages above suggest. Understanding markup structure is important for anyone budgeting against a mix of staff and agency workers.
Agency markup basics
For temporary or per-diem clinical staff, agencies typically charge a bill rate to the client facility that includes the worker's pay, payroll taxes, benefits, workers' compensation, liability coverage, and the agency's margin. The total markup over base wages runs:
- Per-diem RN placements: 35 to 50 percent over the base wage rate
- Short-term temporary allied health placements: 30 to 45 percent over base wages
- Management and director-level interim placements: 20 to 35 percent of annual salary as a placement fee
- Permanent direct hire placements: 18 to 25 percent of first-year salary (AMN Healthcare, 2025 Healthcare Staffing Market Outlook)
For context: a staff RN earning $41/hr has a base annual wage of $85,280. An agency placing a temporary RN at a 45 percent markup bills the facility approximately $59/hr, or about $122,000 annualized for a full-time equivalent position. That is the financial tradeoff between flexibility and cost.
Travel nurse rates in 2026
Travel nursing rates peaked in late 2021 and early 2022, when some bill rates exceeded $200/hr on high-acuity assignments. Rates have since normalized but have not returned to pre-pandemic levels.
| Metric | 2019 (Pre-Pandemic) | 2022 (Peak) | 2024-2026 (Current) |
|---|---|---|---|
| Average travel RN weekly package | $1,600 | $4,500-$6,000 | $2,100-$2,800 |
| Travel RN bill rate vs. staff rate | +20-30% | +150-200% | +40-70% |
| Share of hospital RN hours from travel staff | 3-5% | 22-25% | 7-10% |
| Annual travel nurse spend (U.S. hospitals) | ~$3.0 billion | ~$17.6 billion | ~$6.1 billion |
Sources: NSI Nursing Solutions, 2025; Staffing Industry Analysts, Healthcare Staffing Report 2025; AMN Healthcare, Q4 2025 Workforce Solutions Report.
The $6.1 billion figure for 2024-2025 travel nurse spend is more than double the pre-pandemic run rate. Health systems that built clinical care models around travel labor during the pandemic have found it harder than expected to wind that dependency down.
4. Vacancy rates and time-to-fill by role
Vacancy rates and time-to-fill have direct budget implications: an unfilled nursing position does not save money. It generates overtime costs, agency spend, or both.
| Role | National Vacancy Rate | Average Days to Fill |
|---|---|---|
| Registered Nurse | 16.8% | 87 |
| Nurse Practitioner | 18.3% | 102 |
| Licensed Practical Nurse | 14.2% | 76 |
| Surgical Technologist | 21.4% | 118 |
| Radiologic Technologist | 19.1% | 94 |
| Respiratory Therapist | 22.6% | 124 |
| Medical Assistant | 11.3% | 48 |
| Medical Lab Technician | 23.8% | 131 |
| Pharmacy Technician | 12.7% | 41 |
| Patient Care Technician | 13.5% | 45 |
Sources: NSI Nursing Solutions, 2025 National Health Care Retention and RN Staffing Report; AMN Healthcare, 2025 Allied Workforce Shortage Survey.
A few of those numbers deserve attention. Medical lab technicians have the highest vacancy rate in the table at 23.8 percent, which most healthcare administrators would not list as their top staffing concern. Yet an understaffed lab slows throughput for every clinical department that depends on test results. Respiratory therapists at 22.6 percent vacancy are in a similar position, acutely visible during flu season and invisible the rest of the year until they are not.
The 87 days to fill an RN position means nearly three months of gap coverage through overtime, per-diem staff, or travel nurses. At 40 to 70 percent above staff rates for travel coverage, a 90-day vacancy for one RN position can cost $15,000 to $25,000 above the budgeted salary before the seat is filled.
5. Projected staffing shortages through 2030
The current vacancy rates reflect structural workforce trends that will not self-correct in the near term.
Nursing
- The U.S. will need to place 200,000 new nurses per year through 2026 to meet growing demand and replace retiring nurses, according to the American Association of Colleges of Nursing (AACN, 2025 Nursing Shortage Fact Sheet).
- Nursing schools turned away 89,155 qualified applicants in 2023, not due to lack of interest but due to insufficient clinical placement sites, classroom space, and nursing faculty (AACN, 2024).
- The average age of a U.S. registered nurse is 44 years. An estimated 1 million RNs will reach retirement age by 2030 (AACN, 2025).
- States with the most severe projected RN shortfalls through 2030 include California, Texas, New Jersey, South Carolina, and Alaska (Health Resources and Services Administration, 2024 National and State-Level Projections of Clinician Supply and Demand).
Physicians
- The AAMC 2024 projections show a total physician shortage of 37,800 to 124,000 by 2034. The primary care deficit alone ranges from 20,200 to 40,400 physicians.
- Rural counties are disproportionately affected: 80 percent of federally designated Health Professional Shortage Areas are in rural or frontier regions (Health Resources and Services Administration, 2025).
- About 45 percent of currently practicing physicians in the U.S. are 55 or older, which means a large-scale retirement wave will intersect with demographic demand growth over the same ten-year window (AAMC, 2024).
Allied health
- AMN Healthcare projects that demand for allied health professionals will grow 25 to 30 percent by 2030, while supply is projected to increase by only 11 to 14 percent (AMN Healthcare, 2025 Allied Workforce Shortage Survey).
- Clinical laboratory scientists face the most severe imbalance: 67 percent of laboratory directors reported difficulty finding qualified candidates in 2024, up from 53 percent in 2021 (American Society for Clinical Pathology, 2024 Wage Survey).
These projections matter for budgeting because they set a floor on what recruitment and retention will cost. If the shortage is structural and multi-year, strategies that treat it as a temporary tight market will consistently underspend on retention and overspend on reactive recruiting.
6. The burnout and turnover problem
Turnover is where staffing shortages become measurable budget losses. The healthcare industry has some of the highest turnover rates and replacement costs of any U.S. sector.
RN turnover: the anchor number
The NSI Nursing Solutions 2025 National Health Care Retention and RN Staffing Report provides the most widely cited benchmarks:
- The national average RN turnover rate was 18.4 percent in 2024.
- Replacing one registered nurse costs an average of $56,300, accounting for recruiting and advertising, agency or overtime gap coverage, onboarding and orientation, and the productivity shortfall while the new hire reaches full competence.
- The median hospital in the NSI survey turned over 74 RNs in 2024. At $56,300 per departure, that is $4.2 million in turnover cost for a single facility.
- U.S. hospitals collectively spent approximately $6.6 billion on RN turnover in 2024.
Turnover varies by unit. The NSI data shows that progressive care units, step-down units, and behavioral health floors tend to run 4 to 8 percentage points above the hospital-wide average, while operating room and NICU nurses turn over at lower rates but cost significantly more to replace because of the specialized training required.
Burnout as a driver
Burnout is not a soft metric when it has a $56,300 price tag attached to each person who leaves because of it.
- 56 percent of nurses reported symptoms of burnout in 2024, including emotional exhaustion, reduced personal accomplishment, and depersonalization of patients (American Nurses Foundation, 2024 Pulse on the Nation's Nurses Survey).
- Burnout was the primary reason given for voluntary departure among nurses with fewer than five years of experience in the job (ANF, 2024).
- Hospitals with better nurse-to-patient ratios have 30 percent lower RN turnover rates than facilities operating above recommended staffing ratios, controlling for geography and patient mix (University of Pennsylvania School of Nursing, 2024 Journal of Nursing Administration).
- Mandatory overtime, a common stop-gap when vacancy rates are high, correlates with 40 percent higher burnout rates among nurses who work it regularly (Occupational and Environmental Medicine, 2024).
The self-reinforcing quality of this dynamic is worth naming directly. Vacancies create overtime pressure, which drives burnout, which drives more departures, which creates more vacancies. Breaking that loop requires either more pipeline (hard and slow) or dramatically reducing the administrative burden that falls on clinical staff (faster, more tractable).
Turnover costs for other roles
| Role | Average Turnover Rate | Average Replacement Cost | Source |
|---|---|---|---|
| Registered Nurse | 18.4% | $56,300 | NSI, 2025 |
| Nurse Practitioner | 14.7% | $84,200 | Advisory Board, 2025 |
| Medical Assistant | 22.1% | $14,800 | SHRM, 2025 |
| Patient Services Rep | 31.4% | $7,600 | SHRM, 2025 |
| Healthcare Admin / Office | 24.3% | $16,200 | SHRM, 2025 |
| Physical Therapist | 15.2% | $61,000 | APTA, 2024 |
| Radiology Technologist | 17.8% | $29,400 | AMN Healthcare, 2025 |
Medical assistants and patient services representatives turn over at rates above 20 and 30 percent respectively, which rarely gets the same leadership attention as nursing turnover but adds up fast across a multi-clinic health system.
7. Cost-per-hire by role
Beyond replacement costs, understanding what it costs to recruit and onboard a new hire gives a clearer picture of the full staffing investment.
| Role | Agency / Recruiter Fee | Job Board / Advertising | Onboarding / Training | Time-to-Productivity | Total Cost-per-Hire |
|---|---|---|---|---|---|
| Registered Nurse | $8,000-$14,000 | $1,200-$2,400 | $3,500-$6,000 | 3-4 months | $13,000-$23,000 |
| Nurse Practitioner | $12,000-$22,000 | $1,500-$3,000 | $4,000-$8,000 | 4-6 months | $18,000-$34,000 |
| LPN | $5,000-$9,000 | $800-$1,600 | $2,000-$3,500 | 4-8 weeks | $8,000-$14,000 |
| Medical Assistant | $2,500-$5,000 | $400-$1,200 | $1,200-$2,500 | 2-4 weeks | $4,000-$9,000 |
| Radiologic Technologist | $7,000-$12,000 | $1,000-$2,000 | $2,500-$4,500 | 4-8 weeks | $11,000-$19,000 |
| Physical Therapist | $8,000-$15,000 | $1,200-$2,400 | $3,000-$5,000 | 4-8 weeks | $12,000-$22,000 |
| Medical Lab Scientist | $7,500-$13,000 | $1,000-$2,000 | $3,000-$5,500 | 6-10 weeks | $12,000-$21,000 |
| Healthcare Admin | $2,000-$4,000 | $400-$1,000 | $800-$1,800 | 1-3 weeks | $3,000-$7,000 |
Sources: AMN Healthcare, 2025; Advisory Board, 2025 Workforce Benchmarking; SHRM, 2025.
Note that these are direct recruiting and onboarding costs, not replacement costs. The full economic impact of a departure includes the gap coverage costs, productivity loss during transition, and the morale effects on remaining staff that are harder to quantify.
8. In-house vs. staffing agency vs. outsourced admin
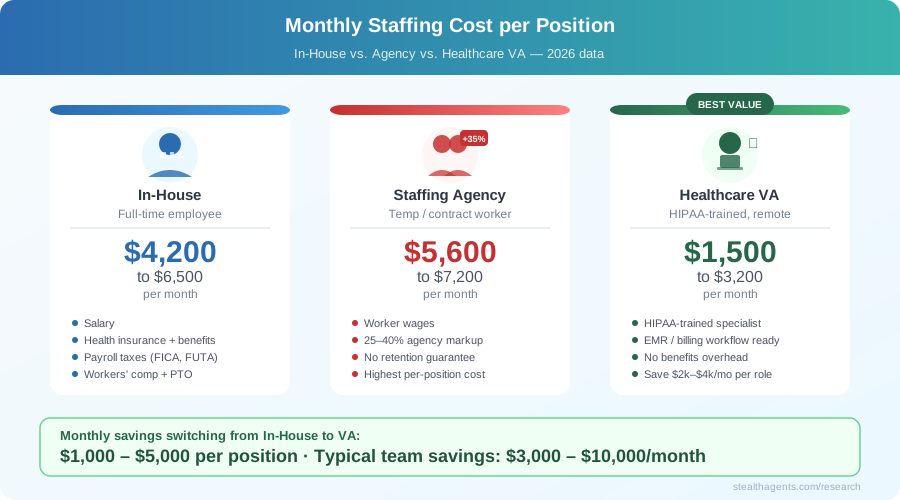
Healthcare organizations typically use all three staffing models simultaneously, and the cost structure looks different depending on the role and the time horizon.
| Model | Typical Cost Range | Flexibility | Lead Time | Best Fit |
|---|---|---|---|---|
| In-house clinical staff | Base wages + 28-42% loaded cost | Low | 3-4 months to fill | Core stable volume, long tenure expected |
| Per-diem / agency clinical | 35-50% markup over base wages | High | Days to weeks | Seasonal surges, short-term vacancies |
| Travel nurses | $2,100-$2,800/week package | High | 1-3 weeks | Extended vacancies, rapid census changes |
| In-house admin staff | Base wages + 25-35% loaded cost | Low | 4-6 weeks to fill | High-volume, complex admin functions |
| Outsourced admin / VA | $8,000-$20,000/year | High | Days to 2 weeks | Standard admin, scheduling, data entry, billing support |
The administrative side of this comparison has been getting more attention from practice managers and hospital CFOs, partly because the savings are large and the implementation risk is lower than for clinical roles.
A full-time in-house medical secretary earning the national median of $42,350 costs approximately $54,000 to $59,000 per year fully loaded with benefits, payroll taxes, and overhead allocation. An experienced virtual assistant with healthcare administrative background costs $10,000 to $22,000 per year depending on scope and hours, with no employer-side benefits, payroll taxes, or workspace costs.
That is a 60 to 75 percent cost differential for functions like appointment scheduling, patient intake documentation, referral coordination, insurance verification, and provider credentialing support.
9. What healthcare organizations are outsourcing in 2026
Healthcare virtual assistant and outsourcing adoption has grown significantly since 2022. The functions that have migrated most readily to remote support models include:
- Prior authorization support and insurance verification
- Appointment scheduling and reminder calls
- Patient intake form management and EHR data entry
- Medical billing support and claims follow-up
- Provider credentialing document tracking
- Referral coordination and specialist scheduling
- Patient satisfaction survey administration
- Medical transcription and clinical documentation support
Functions that tend to stay in-house or require on-site staffing include clinical care coordination requiring patient interaction, HIPAA-sensitive tasks requiring secure certified workflows, and administrative roles tied to physical presence at check-in or care transitions.
The Healthcare Business Insights report from 2025 found that 34 percent of ambulatory care practices with 5 to 50 providers now use at least one form of outsourced administrative support, up from 18 percent in 2021. The shift is more pronounced in independent practices and specialty groups than in large hospital-owned networks, where procurement processes slow adoption.
Health systems using virtual assistants for administrative support tasks report administrative staff cost reductions of 55 to 72 percent on shifted functions, and more importantly, they report that clinical staff spend less time on non-clinical tasks, which has measurable effects on satisfaction scores and some evidence of correlation with retention (Becker's Hospital Review, 2025).
10. Total staffing cost
Here is the annualized staffing cost for a primary care practice with four physicians and approximately 6,000 patient visits per year.
| Role | Count | Annual Salary (Median) | Loaded Cost (1.32x) |
|---|---|---|---|
| Physician (Primary Care) | 4 | $236,000 each | $1,245,952 |
| Nurse Practitioner | 1 | $129,790 | $171,323 |
| Registered Nurse (Care Coordinator) | 1 | $86,070 | $113,612 |
| Medical Assistant | 4 | $40,700 each | $214,896 |
| Medical Secretary / Front Desk | 2 | $42,350 each | $111,804 |
| Medical Billing Specialist | 1 | $46,900 | $61,908 |
| Practice Manager | 1 | $82,400 | $108,768 |
| Total | 14 FTE | - | $2,028,263 |
At a $2 million staffing cost against typical primary care revenue of $2.2 to $2.8 million for a 4-physician practice, labor accounts for 72 to 92 percent of gross revenue before facility, malpractice, supplies, and technology costs. That is why physician practice margins are thin and why administrative cost reduction often receives more attention than revenue cycle optimization in smaller practices.
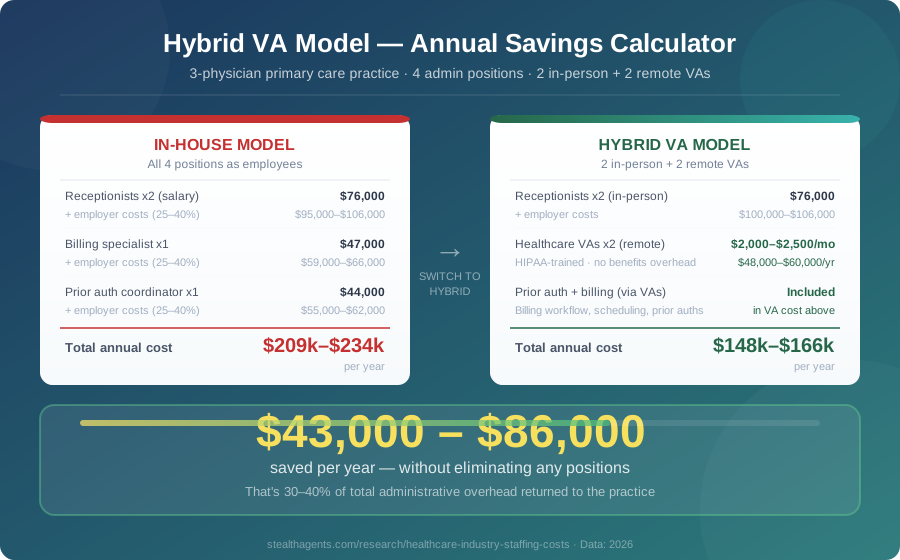
If the two front-desk and billing roles shifted to outsourced virtual support at $14,000 to $18,000 each, the practice would save $55,000 to $80,000 per year without reducing clinical headcount. In a practice with 8 to 10 percent net margins, that is a material difference.
11. Key statistics summary
| Statistic | Value | Source |
|---|---|---|
| National RN vacancy rate | 16.8% | NSI, 2025 |
| Average days to fill RN vacancy | 87 days | NSI, 2025 |
| National RN turnover rate | 18.4% | NSI, 2025 |
| Average RN replacement cost | $56,300 | NSI, 2025 |
| Annual U.S. hospital RN turnover spend | $6.6 billion | NSI, 2025 |
| Nurses reporting burnout symptoms | 56% | ANF, 2024 |
| Medical assistant turnover rate | 22.1% | SHRM, 2025 |
| Patient services rep turnover rate | 31.4% | SHRM, 2025 |
| RN median annual wage | $86,070 | BLS OEWS, 2024 |
| Nurse practitioner median annual wage | $129,790 | BLS OEWS, 2024 |
| Medical assistant median annual wage | $40,700 | BLS OEWS, 2024 |
| Medical secretary median annual wage | $42,350 | BLS OEWS, 2024 |
| Travel nurse weekly package (2026) | $2,100-$2,800 | SIA / AMN, 2025 |
| Travel nurse cost premium over staff | 40-70% | NSI / AMN, 2025 |
| Agency markup over base wages (temp clinical) | 35-50% | AMN, 2025 |
| Physician shortage projected by 2034 | 37,800-124,000 | AAMC, 2024 |
| Primary care physician shortage by 2034 | 20,200-40,400 | AAMC, 2024 |
| Practices using outsourced admin support | 34% | Healthcare Business Insights, 2025 |
| Admin cost reduction with VA model | 60-75% | Stealth Agents, 2025 |
Controlling healthcare staffing costs in 2026
The nursing shortage will not resolve in 2026. It will not resolve in 2028, either. The pipeline constraints, from limited nursing faculty to capped clinical placement sites, mean that new RN supply growth will remain insufficient through at least the end of this decade. Health systems that plan staffing budgets around the assumption of a returning "normal" labor market are consistently going to be surprised.
Turnover is where the math most often goes wrong in healthcare budgets. A $56,300 replacement cost per RN departure means that a mid-size hospital losing 74 nurses per year spends $4.2 million just making itself whole, before any growth or improvement in staffing ratios. The employee turnover rate by industry data shows that healthcare sits at or near the top of every sector comparison. Retention investment that costs $5,000 to $8,000 per nurse per year in scheduling flexibility, workplace improvements, or reduced mandatory overtime often saves two to three times that in avoided turnover costs.
On the travel nurse question: $6.1 billion in annual travel RN spend across U.S. hospitals is roughly double the pre-pandemic baseline, and most of that cost is sticky because it is now embedded in clinical staffing models. Systems that have reduced travel dependency have typically done it through accelerated orientation for new graduates, structured transition-to-practice programs, and per-diem pools built from local float staff rather than agency contracts. It takes two to three years and consistent execution.
Administrative cost is where the fastest savings are available. The comparison between a $54,000 fully loaded in-house medical secretary and a $14,000 to $18,000 outsourced virtual assistant is not subtle. The functions that transfer well, including scheduling, prior auth support, credentialing tracking, billing follow-up, and data entry, do not require physical presence and do not involve direct patient care. Understanding the full cost of hiring an employee makes the alternative model's economics clear.
Healthcare is also worth benchmarking against adjacent industries facing similar cost pressure. The construction industry staffing costs 2026 data shows how another labor-intensive, shortage-affected sector is approaching workforce cost management, and some of the patterns around overtime, turnover, and administrative outsourcing translate directly. The legal industry staffing costs 2026 article covers a similar set of dynamics in a professional services context where compliance overhead and billing complexity drive comparable administrative cost structures.
The hospitals and health systems that are managing labor cost most effectively in 2026 share a few characteristics: they invest in retention rather than just recruiting, they have clear policies on when to use agency versus staff labor, and they have aggressively shifted eligible administrative functions to lower-cost models. None of that is complicated. The difficulty is execution consistency over a multi-year horizon when every staffing crisis looks like an emergency that justifies an exception.
Sources
- Bureau of Labor Statistics (BLS) - Occupational Employment and Wage Statistics (OEWS), May 2024 (released March 2025)
- Bureau of Labor Statistics (BLS) - Occupational Outlook Handbook, Healthcare Occupations, 2024
- NSI Nursing Solutions - 2025 National Health Care Retention and RN Staffing Report
- Association of American Medical Colleges (AAMC) - The Complexities of Physician Supply and Demand: Projections from 2021 to 2036, 2024 Update
- AMN Healthcare Workforce Solutions - 2025 Healthcare Staffing Market Outlook
- AMN Healthcare Workforce Solutions - 2025 Allied Workforce Shortage Survey
- AMN Healthcare Workforce Solutions - Q4 2025 Workforce Solutions Report
- American Association of Colleges of Nursing (AACN) - 2025 Nursing Shortage Fact Sheet
- American Association of Colleges of Nursing (AACN) - 2024 Enrollment and Graduations in Baccalaureate and Graduate Programs in Nursing
- American Nurses Foundation (ANF) - 2024 Pulse on the Nation's Nurses Survey
- American Society for Clinical Pathology - 2024 Wage Survey of Medical Laboratories and Pathology Groups
- American Physical Therapy Association (APTA) - 2024 Physical Therapist Workforce Analysis
- Health Resources and Services Administration (HRSA) - 2024 National and State-Level Projections of Clinician Supply and Demand
- Staffing Industry Analysts (SIA) - Healthcare Staffing Report, 2025
- Mercer - National Survey of Employer-Sponsored Health Plans, 2025
- Society for Human Resource Management (SHRM) - Benefits Benchmarking Report, 2025
- Advisory Board - 2025 Healthcare Workforce Benchmarking Report
- Healthcare Business Insights - 2025 Ambulatory Practice Staffing Survey
- University of Pennsylvania School of Nursing - Nurse Staffing Ratios and Turnover, Journal of Nursing Administration, 2024
- Becker's Hospital Review - Healthcare Administrative Outsourcing Trends, 2025
Frequently Asked Questions
What are the main staffing costs in the Healthcare sector?
Staffing typically represents 30-50% of operating costs in the Healthcare sector. Total compensation (salary, benefits, payroll taxes) averages 25-40% above base salary. Recruiting and onboarding add $5,000-$20,000 per hire depending on role seniority and specialization.
What are the biggest staffing challenges facing Healthcare in 2026?
The Healthcare sector faces skills shortages in specialized roles, rising compensation expectations, and increased competition for talent. Remote and hybrid work has both expanded the talent pool and increased attrition as workers gain location flexibility.
How can Healthcare companies reduce staffing costs without sacrificing quality?
Effective cost reduction strategies include: leveraging virtual assistants for administrative and operational support ($1,500-$3,000/month vs. $50,000-$80,000+ full-time equivalent), outsourcing non-core functions to specialist providers, automating repetitive workflows, and improving retention through better onboarding and career paths.
Related Reading
Tags
Ready to put this into practice?
Book a free 15-min match call
Tell us what role you're filling. We'll match you with a pre-vetted virtual assistant - or tell you honestly if we're not the right fit.
Book a free call →