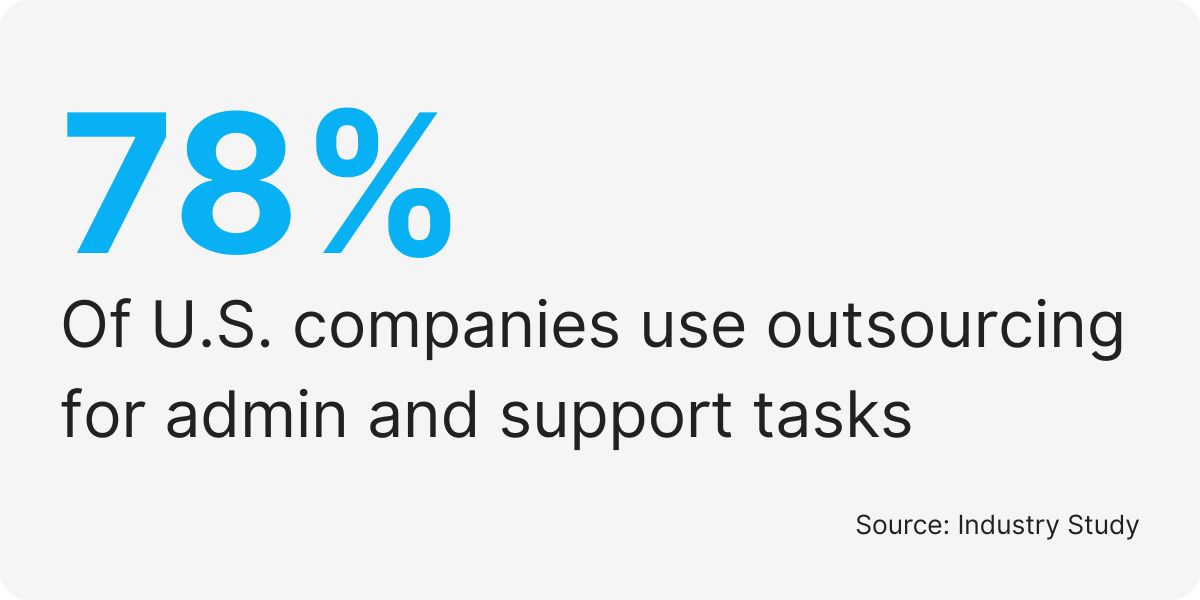
Recent studies show that 78% of American companies now use outsourcing services to handle tasks like customer service, data entry, and admin work.
Are you tired of spending your time on tasks that don't grow your business?
Outsourcing in the U.S At A Glance
Here is a quick look at what outsourcing can do for your business.
| Feature | Details |
|---|---|
| Main Tasks | Admin work, customer service, data entry, scheduling |
| Experience Level | 10+ years |
| Cost Savings | Up to 80% vs in-house |
| Availability | Full-time, dedicated to you |
| Support | Campaign Manager included |
This table shows how outsourcing can help your business save money and time while getting expert help.
What Does A U.S Outsourcing Service Do?
U.S outsourcing services handle many different tasks for your business.
These services take care of work that takes up your time but doesn't make you money.
-
Customer service – answer phones and emails from customers
-
Data entry – put information into spreadsheets and databases
-
Admin tasks – schedule meetings and manage your calendar
-
Social media – post updates and reply to comments
-
Research – find information about competitors and markets
-
Email management – sort and reply to important emails
-
Bookkeeping – track expenses and prepare financial reports
These tasks can take up hours of your day, but outsourcing lets you focus on growing your business instead.
💡
Did You Know?
Companies that use outsourcing in the U.S save an average of 15 hours per week that they can spend on making money instead of doing admin work.
Why Businesses Choose U.S Based Outsourcing
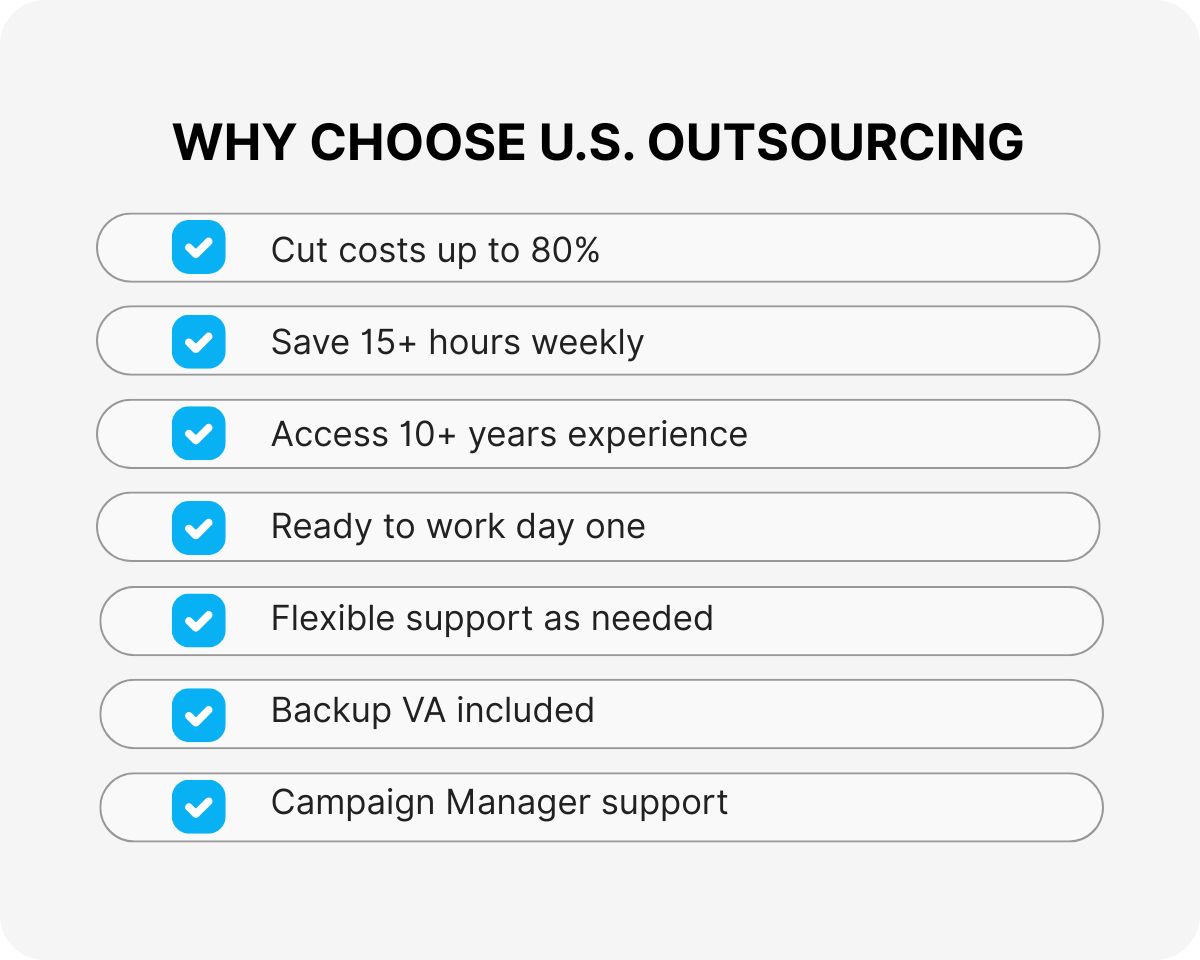
There are many good reasons to choose outsourcing services in the United States.
The biggest reason is saving money – you can cut costs by up to 80% compared to hiring full-time workers with benefits and office space.
You also save time by getting back 15 or more hours each week that you used to spend on tasks that don't make money.
Plus you get expert help from people with 10 or more years of experience who know how to do the work right the first time.
-
No training needed – ready to work on day one
-
Flexible support – adapts to your needs
-
Backup VA included – work never stops
-
Campaign Manager – helps you succeed
These benefits mean you can grow your business faster while spending less money on overhead costs.
American Outsourcing vs In-House Employee
Here is how outsourcing in America compares to hiring your own worker.
| Factor | Stealth Agents VA | In-House Employee |
|---|---|---|
| Cost | Save up to 80% | Full salary + benefits |
| Experience | 10+ years guaranteed | Varies widely |
| Hiring Process | We handle everything | You do all the work |
| Backup Support | Backup VA included | No backup if sick |
| Management | Campaign Manager helps | You manage alone |
| Guarantee | Replacement guarantee | No guarantees |
For most small and medium businesses, outsourcing is the better choice because of lower costs and less work for you.
What To Look For In U.S Outsourcing Partners
Not all outsourcing services are the same, so you need to know what makes a great partner.
Communication skills are super important – your outsourcing partner needs to write clear emails and be a good listener who understands what you need.
Organization skills matter too because they need to keep track of all your tasks and meet deadlines without you having to remind them.
Tech skills are also key – they should know how to use tools like email programs, spreadsheets, and customer management systems like HubSpot or Salesforce.
Stealth Agents virtual assistants have all these skills and more because we only work with experienced professionals.
We hire only the top 1% of people who apply, so you know you are getting someone really good.

💡
Outsourcing in the U.S Pro Tip
Start with 2-3 simple tasks when you begin outsourcing in the U.S, then add more work as you build trust with your virtual assistant.
How To Get Started With Outsourcing Services In America
Getting started with outsourcing is easier than you might think.
The first step is to book a free discovery call with Stealth Agents where we talk about what you need and what tasks you want help with.
Next, we match you with the perfect virtual assistant in just a few days based on your needs and the type of work you do.
Then you share your goals with your new VA and give them access to the tools and programs they need to help you.
Your Campaign Manager will help with getting everything set up and making sure your VA knows exactly what you want them to do.
Within a week, you will be ready to start growing your business while your VA takes care of the busy work.

Getting The Best Results From Your Outsourcing Partnership
Working well with your outsourced team takes some planning, but it is not hard to do.
Being clear is the most important thing – write down step-by-step instructions for each task so there is no confusion about what you want.
Trust is also key – let your VA do the work without checking on them every hour, then look at the results at the end of each day.
Good communication means having a quick call or video chat each week to talk about what is working and what needs to change.
Starting small works best – begin with just a few tasks and add more work over time as you both get comfortable working together.
If things are not working out, Stealth Agents has a replacement guarantee so you can try a different VA at no extra cost.
Businesses in the US cold calling services are also making more money. Remote admin cost per tasks are more affordable when outsourced vs hiring in-house employees.

Why Choose Stealth Agents For Your Outsourcing in the U.S
Stealth Agents is the best choice when you need outsourcing services in America.
All our virtual assistants have 10+ years of experience doing the work you need help with.
We hire only the top 1% of people who apply, so you get someone who really knows what they are doing.
-
Dedicated Campaign Manager to help you
-
Backup VA included at no extra cost
-
Replacement guarantee if not satisfied
-
Easy communication through our platform
Book a free call today to learn how we can help your business grow while saving you time and money.
🎯
Key Takeaway
Outsourcing in the U.S can save your business up to 80% on costs while giving you expert help and 15+ hours back each week to focus on making money.
Frequently Asked Questions About Outsourcing in the U.S
How Do I Hire A U.S Outsourcing Service From Stealth Agents?
Just book a free discovery call on our website and we will match you with the perfect VA in just a few days.
What Tasks Can American Outsourcing Services Handle?
They can do admin work, customer service, data entry, social media, research, email management, and bookkeeping tasks.
How Much Experience Do Your U.S Based Virtual Assistants Have?
All our VAs have 10+ years of experience and we only hire the top 1% of applicants.
How Will I Communicate With My Outsourcing Team?
You can use email, Slack, Zoom, or our platform to talk with your VA every day.
What If My U.S Outsourcing Partner Is Not A Good Fit?
We have a replacement guarantee so you can try a different VA at no extra cost if the first one doesn't work out.
Get Your Outsourcing in the U.S Today
Outsourcing can save your business money, give you expert help, and free up your time to focus on making money.
Don't wait any longer to start using outsourcing in the U.S to grow your business faster than ever before.
Book your free discovery call with Stealth Agents right now and see how much time and money you can save.